
A quick tour
Jimping has two views. Watch keeps an eye on a list of hosts at a glance. Trace runs a continuous traceroute and shows where the delay and loss actually are. Here is what you are looking at in each.
Keep an eye on the things you care about
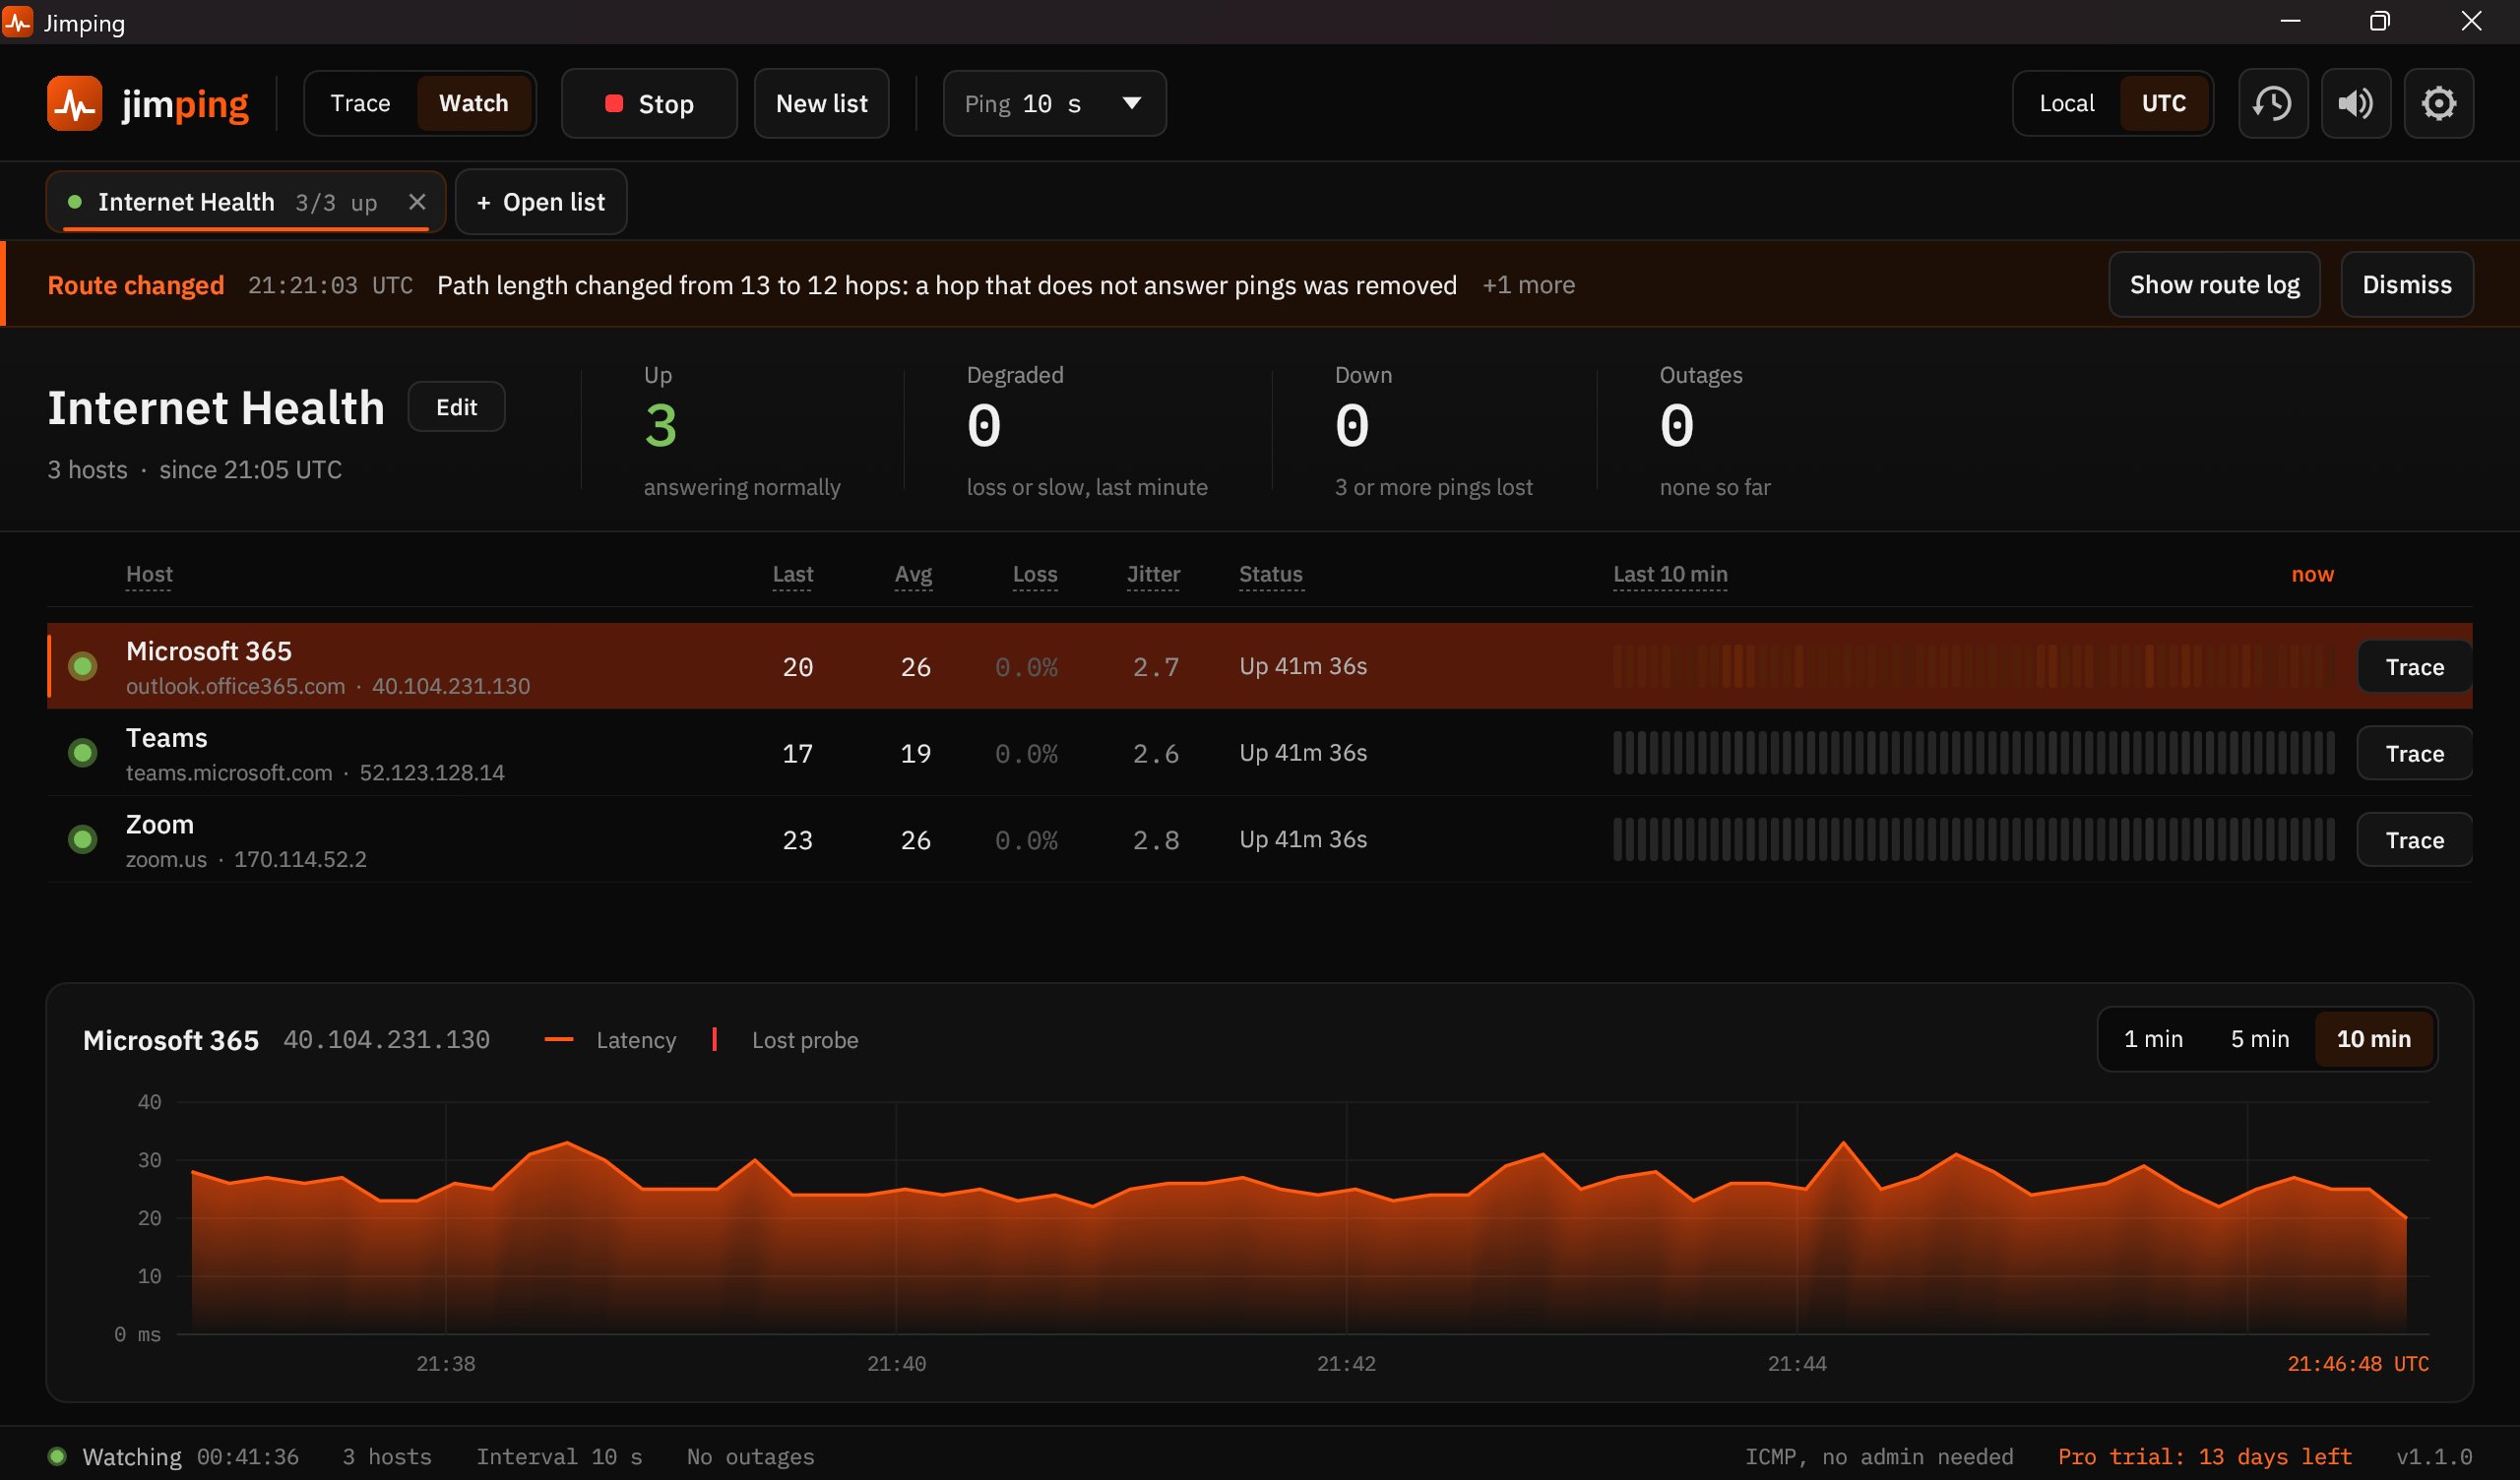
Point Watch at a handful of hosts — your apps, your gateway, a VPN endpoint — and it pings them all at once, so you can see in a second whether the problem is you or them.
 1
2
3
4
5
6
7
1
2
3
4
5
6
7
- 1
Trace / Watch
Switch between the two views any time. Watch tracks a list of hosts; Trace follows the full path to one.
- 2
Health at a glance
Up, Degraded, Down and Outages counts for the whole list, so you know the shape of things before reading a single row.
- 3
Your hosts
Each host with a friendly name and the address it resolved to. Add as many as you like and save the list to reopen later.
- 4
The numbers that matter
Last, average, loss, jitter and a plain-language status like “Up 41m 36s” — no decoding required.
- 5
Last 10 minutes
A compact strip of recent pings per host. A glance tells you whether a blip was one packet or a pattern.
- 6
Trace from here
See a host misbehaving? Hit Trace to jump straight into a hop-by-hop path to it and find out where.
- 7
Latency over time
Click a host to chart its latency below, over the last 1, 5 or 10 minutes. Lost pings show as clear red marks.
See exactly where the path breaks down
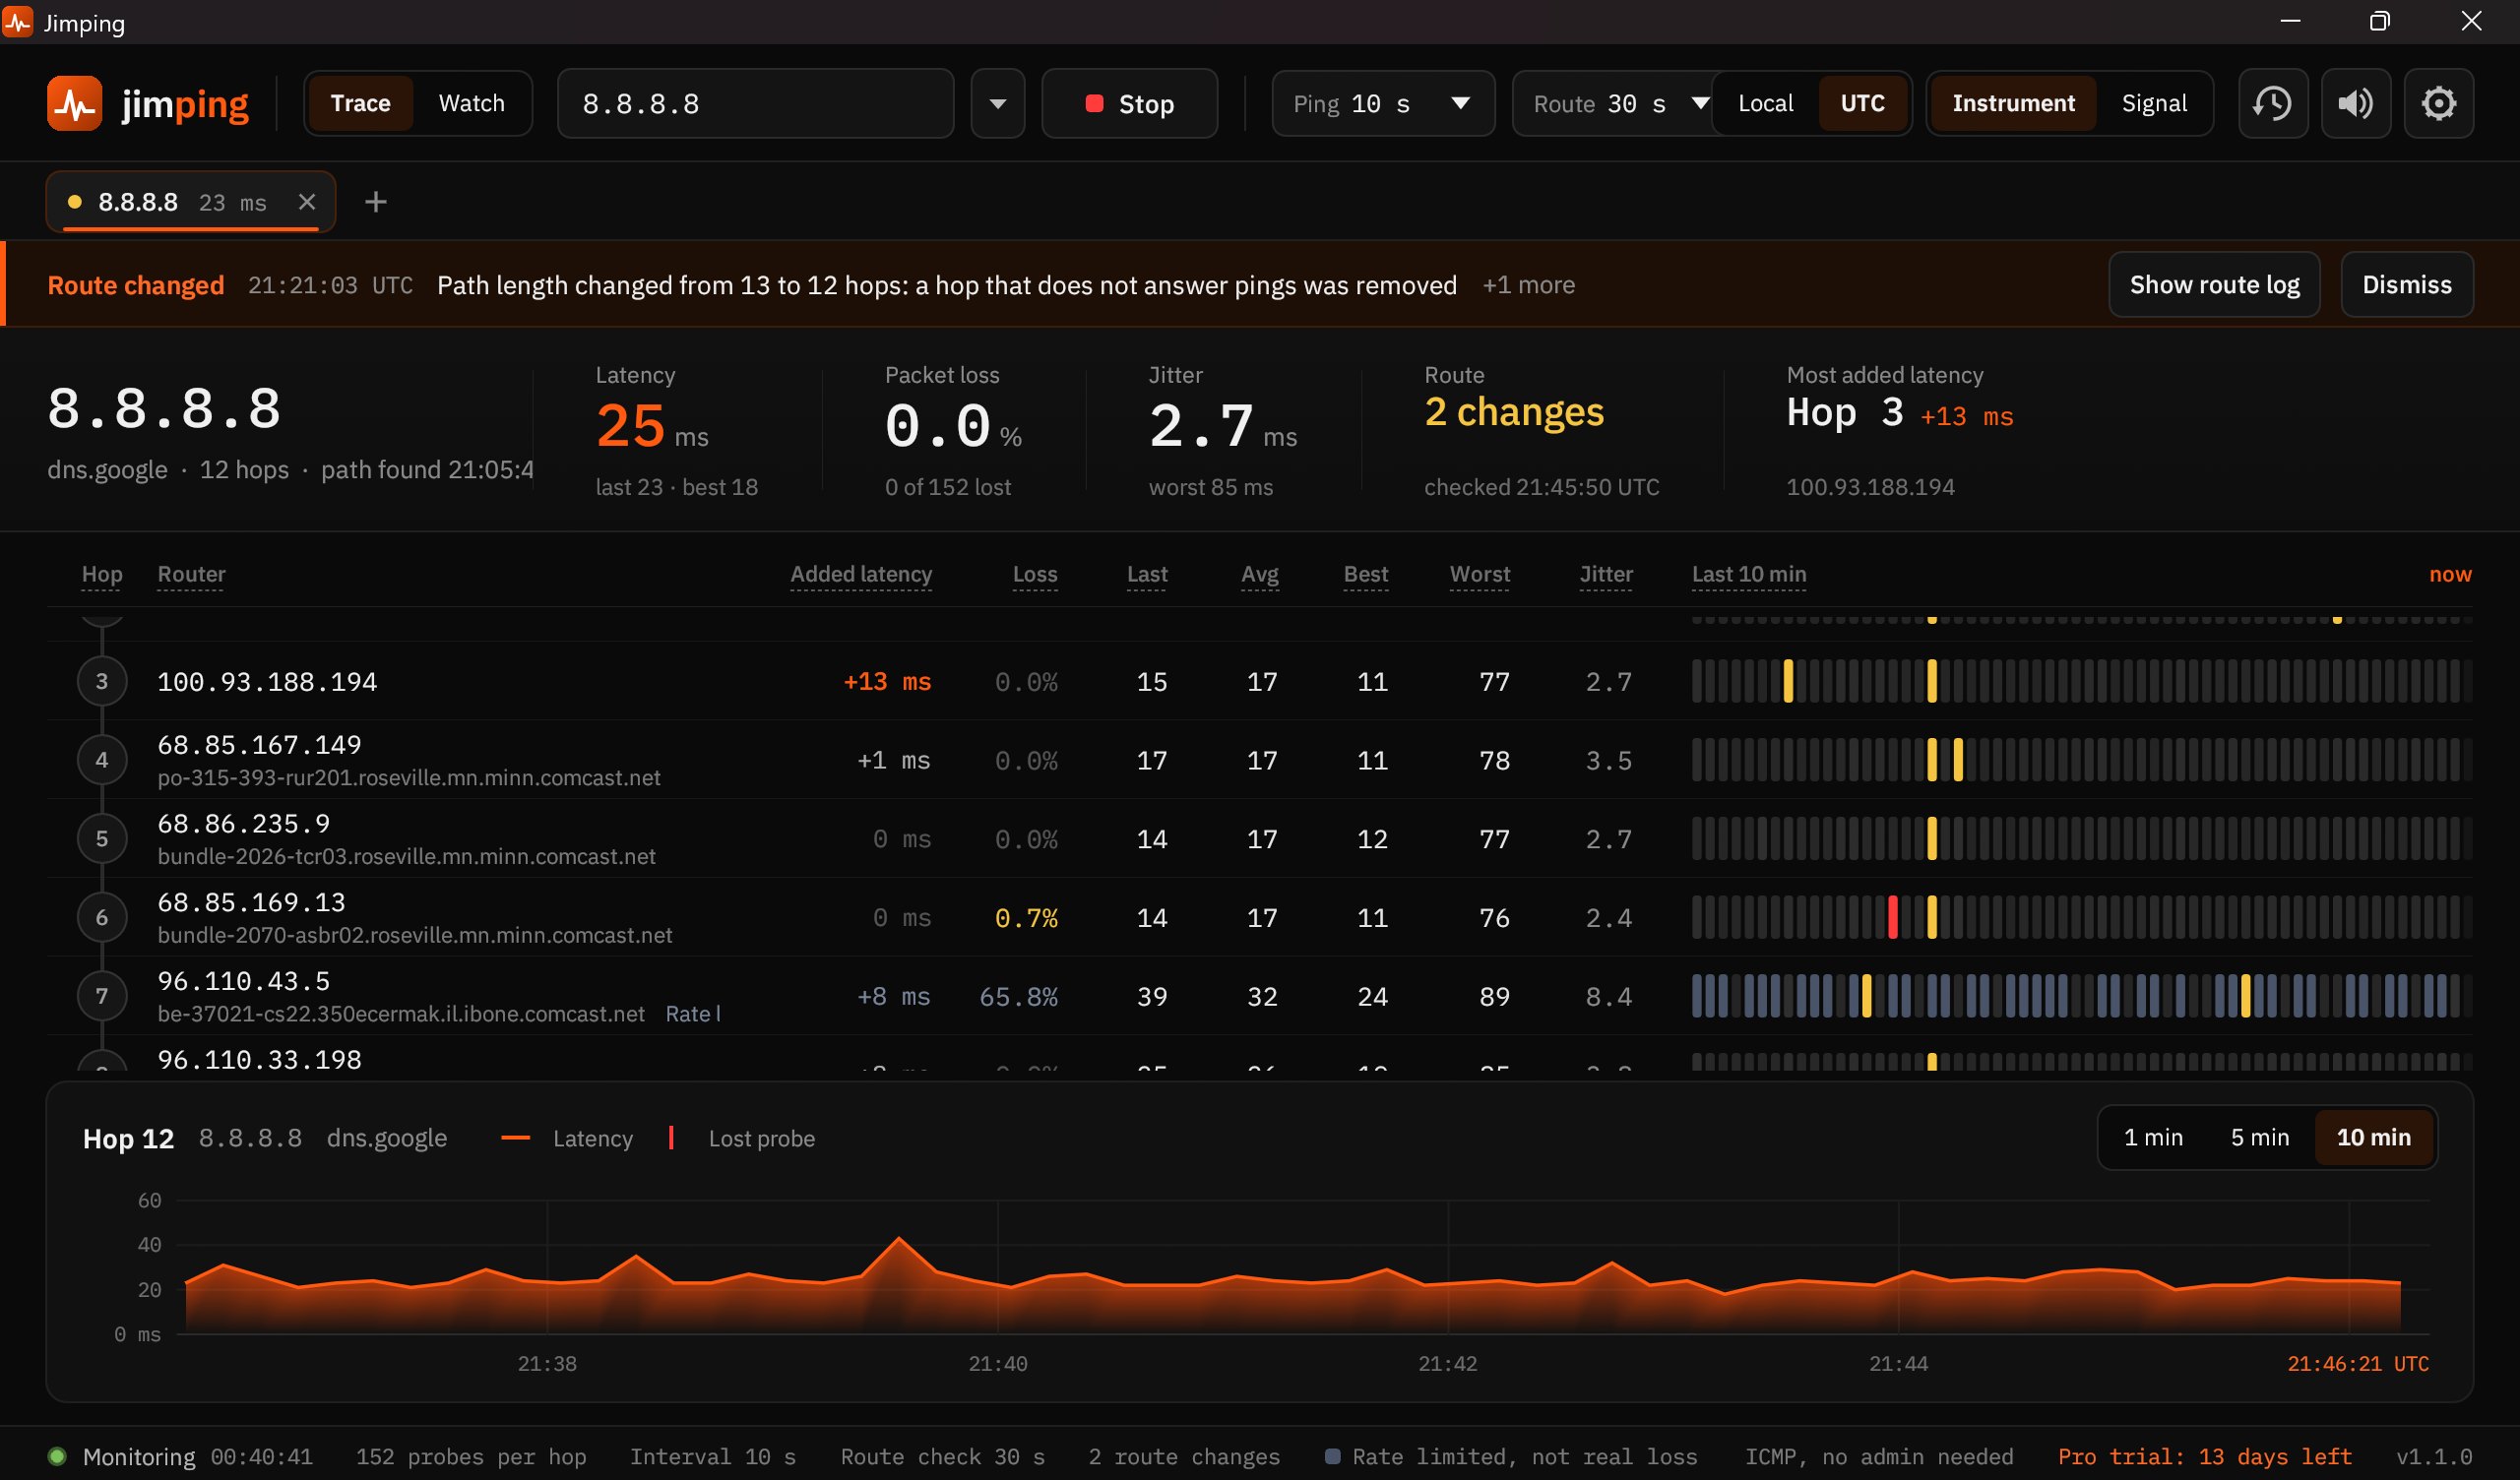
Trace runs a continuous traceroute and keeps pinging every hop. Instead of a one-shot snapshot, you watch each router over time — so an intermittent problem three hops out has nowhere to hide.
 1
2
3
4
5
6
7
1
2
3
4
5
6
7
- 1
Route-change alerts
When the path shifts — a hop added, removed or swapped — Jimping tells you, with a route log you can open.
- 2
Target summary
Overall latency, loss, jitter, how many times the route changed, and which single hop adds the most delay.
- 3
Every hop on the path
The full route with reverse-DNS names, so you can tell your own gateway from your ISP from the backbone.
- 4
Added latency per hop
How much delay each hop contributes. The jump from one row to the next is where the time is actually going.
- 5
Loss, read correctly
Per-hop loss with a heads-up when a router is just rate-limiting its own replies — which looks like loss but isn’t.
- 6
Last 10 minutes, per hop
A history strip for every hop, so a brief spike deep in the path stays visible instead of scrolling away.
- 7
Focus on one hop
Click any hop to chart just that router below over 1, 5 or 10 minutes, with lost probes marked in red.
Try it yourself
Free to use, signed for Windows, no account. Pro unlocks saved lists, longer history and more.
Download Jimping